 Fund your Account
 Contact Support
 For Institutions
 Honor Elite

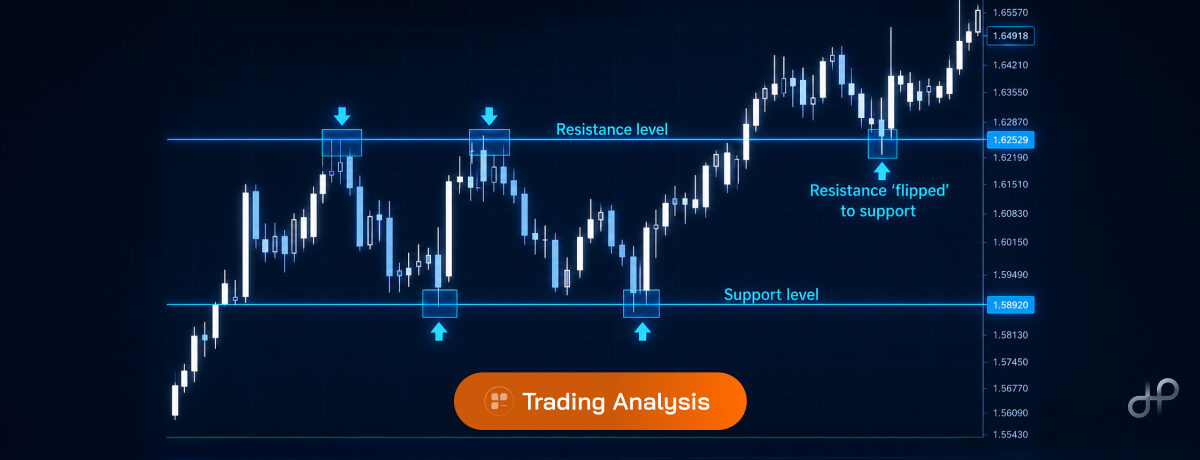
Support and resistance in forex are price levels where buying or selling pressure has historically been strong enough to reverse or stall price movement. Support acts as a floor where buyers step in; resistance acts as a ceiling where sellers defend. Identifying these zones accurately, understanding why they hold, and knowing how to trade around them gives retail traders a structural edge that applies across all major currency pairs and timeframes.
Table of Contents
- What Are Support and Resistance in Forex?
- How to Identify Support and Resistance Levels
- Why These Levels Matter More Than Most Traders Realise
- Support and Resistance Trading Strategy: Practical Approaches
- Common Mistakes Traders Make with These Levels
- Key Takeaways
- Conclusion
- FAQ
What are Support and Resistance in Forex?
Most traders who struggle with support and resistance in forex don’t lack the concept. They’re drawing lines in the wrong places and wondering why price ignores them. This guide covers what these levels actually are, how to find the ones that matter, and how to trade around them without second-guessing every setup.
Support is a price level where buying interest is strong enough to prevent the price from falling further. Think of it as a floor. When price approaches this level repeatedly and bounces upward, it tells you that buyers are stepping in at that price.
Resistance is the opposite: a ceiling where selling pressure is strong enough to stop price from rising further. Each time price approaches that level and reverses downward, sellers are defending it.
These are not arbitrary lines. They reflect real human behaviour, with traders and institutions placing orders at levels they consider fair value, stopping losses, or taking profit. That’s worth remembering before you draw your next horizontal.
How to Identify Support and Resistance Levels
Identifying forex support and resistance levels accurately takes practice, but the mechanics are consistent across currency pairs and timeframes.
Start with the higher timeframe. Load your daily or weekly forex chart first. Price levels that have held for weeks or months carry significantly more weight than those visible only on a 15-minute chart. A level that’s been tested four or five times across multiple months is telling you something real about how market participants value that price.
Here is a simple process to follow:
- Switch to the daily chart and look for obvious historical swing highs and swing lows.
- Draw a horizontal line across any price where the market reversed at least twice.
- Drop to your trading timeframe (e.g. the 4-hour or 1-hour chart) and refine the exact zone.
- Note whether the price reversed sharply at the level or consolidated before moving. Sharp reversals often indicate stronger institutional interest.
- Mark the level as a zone, not a single line. Price rarely turns on the exact same pip (the smallest standard price movement, typically 0.0001 for most major pairs) twice.
Round numbers matter: In major pairs like EUR/USD or GBP/USD, levels ending in .0000 or .0050 tend to attract significant order flow. These psychological price levels see the heaviest participation from both retail traders and larger institutional players.
Practical tip: Use a weekly chart to identify your primary zones, a daily chart to confirm them, and your entry timeframe to time the trade. Working top-down prevents you from placing too much weight on minor levels.
Why These Levels Matter More Than Most Traders Realise
Most traders acknowledge support and resistance levels. Far fewer understand why they work, which is exactly why so many misuse them.
The memory of price is the clearest explanation. When EUR/USD traded at 1.0800 and large institutions placed significant buy orders there, some of those orders may not have been fully filled. When price returns to 1.0800, those unfilled orders re-enter the market. This is not speculation. It’s how order books function at the institutional level.
The psychological dimension is equally real. Retail traders remember price bouncing from a specific level, and when it returns, they act on that memory collectively. That collective behaviour creates the very bounce they anticipated. Self-fulfilling? Partially. But it’s also grounded in real order flow, and the two reinforce each other in ways that make these levels surprisingly durable. Respecting where price has previously reacted is one of the clearest structural edges available to retail traders. Poor trade timing and ignoring key price structure account for a large share of retail losses in forex markets, not simply leverage alone.
Support and Resistance Trading Strategy: Practical Approaches
A support and resistance trading strategy does not need to be complicated. The most reliable approaches share three elements: confirmation, context, and risk management.
1. Bounce Trading
Bounce trading involves entering a trade when price revisits a known level and shows signs of rejection. You’re not guessing that the level will hold. You’re waiting for evidence, typically a rejection candlestick pattern such as a pin bar or an engulfing candle, before committing to anything.
| Approach | Entry Signal | Best Timeframe | Key Risk |
|---|---|---|---|
| Bounce trade | Rejection candle at level | 4H / Daily | False bounce in trending market |
| Breakout trade | Candle close beyond level | 1H / 4H | Fakeout before continuation |
| Range trade | Buy support, sell resistance | 1H / 4H | Breakout invalidates range |
| Confluence trade | Level + indicator alignment | Daily | Over-filtering misses entries |
2. Breakout Trading
When price breaks through a resistance level and closes convincingly above it, that resistance often becomes new support. This “role reversal” is one of the most reliable patterns in technical analysis. Wait for the retest before entering. Entering immediately on the break exposes you to fakeouts, which are fairly common in liquid sessions when volatility (the degree to which price fluctuates over a given period) spikes around news events.
Traders using platforms that offer precise, fast execution get a meaningful advantage here. HonorPro, for example, is designed around the kind of dependable, low-latency order execution that breakout and retest strategies require, where a delayed fill at the wrong price can negate the entire setup.
3. Confluence Trading
Confluence means combining support or resistance with another signal to increase your confidence. Common combinations include a key level aligning with a moving average, a Fibonacci retracement level, or an RSI reading at an extreme. No single signal is infallible. Confluence improves the probability of any given setup without eliminating the underlying risk, and it’s worth remembering that even high-confluence setups fail more often than most traders expect when they’re starting out.
Common Mistakes Traders Make with These Levels
Even experienced traders misuse support and resistance more than they’d admit.
Drawing too many lines is the most common problem. If your chart has fifteen lines on it, you haven’t identified key levels. You’ve drawn noise. Fewer, well-chosen zones from higher timeframes carry more predictive weight than dozens of minor intraday levels cluttering your view.
Treating levels as exact prices leads to poor stops. A level is a zone. If support sits near 1.0800, price might dip to 1.0785 before reversing. A stop placed directly below 1.0800 gets taken out on a legitimate bounce. Not ideal, but it happens constantly to traders who haven’t made the mental shift from line to zone.
Watch out for these errors in your own trading:
- Over-drawing levels: selecting too many zones dilutes the significance of genuinely important ones.
- Ignoring the trend: trading a bounce off support against a strong downtrend is a low-probability setup regardless of how clean the level looks.
- Misreading role reversal: not every break of resistance leads to a clean retest. Some levels are never retested before price accelerates.
- Using levels in isolation: confirmation from price action or broader market context improves the reliability of any level significantly.
Key Takeaways
Support and resistance in forex trading are not magic lines. They are representations of collective market behaviour at specific prices, and understanding that distinction makes you a more precise trader. Used correctly, they give structure to an otherwise chaotic market.
- Support acts as a price floor: buyers defend it repeatedly, making it a candidate for long entries on confirmation.
- Resistance acts as a price ceiling: sellers defend it, making it a candidate for short entries or profit targets.
- Role reversal is reliable: broken resistance can become new support, and that retest is often a high-quality entry point.
- Confluence improves accuracy: combine key levels with trend direction and price action signals before committing to a trade.
Study your charts at the daily level first. Build your levels there. Then drop down to refine your entry.
Conclusion
Support and resistance remain among the most practical tools in a forex trader’s approach, not because they’re complicated, but because they reflect how real participants behave at real prices. Getting the fundamentals right, drawing fewer and better zones, reading level context correctly, and combining levels with confirmation signals, makes a measurable difference to trade quality over time. Whether you trade breakouts, bounces, or confluences, a disciplined approach to price structure is the foundation every other strategy is built on. Keep your chart clean, respect the zone over the line, and let price confirm before you commit.
Frequently Asked Questions
Q1. What is the difference between support and resistance in forex?
A. Support is a price level where buying pressure prevents further decline. Resistance is where selling pressure prevents further gains. Both reflect areas of concentrated order flow and historical market interest, and both can switch roles once decisively broken.
Q2. How many support and resistance levels should I mark on a chart?
A. Focus on two to four key levels per timeframe. More than that and you risk cluttering your chart with noise. The strongest zones are those that have been tested multiple times over weeks or months on higher timeframes like the daily or weekly chart.
Q3. Can support and resistance levels fail?
A. Yes, and they fail regularly. A level that breaks with high volume and a convincing candle close often signals a genuine breakout rather than a fakeout. Always use a stop-loss (an order that automatically closes your trade at a predefined price to limit losses) to protect against failed levels.
Q4. Do support and resistance levels work in all market conditions?
A. They are most reliable in ranging or mildly trending markets. In strongly trending markets, prices can slice through former levels with minimal reaction. Always assess the broader trend before relying solely on a horizontal level for your trade decision.