 Fund your Account
 Contact Support
 For Institutions
 Honor Elite

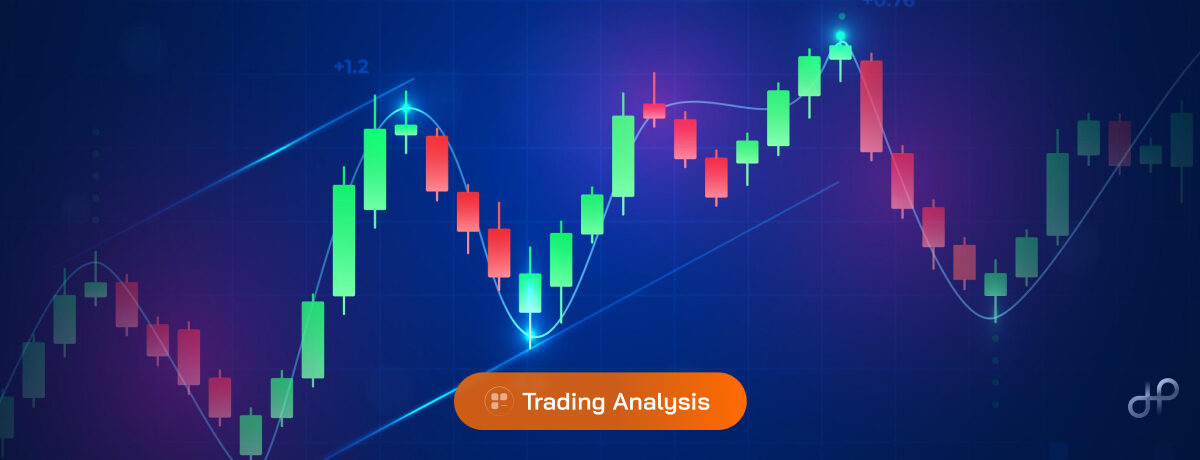
Most traders blow through their first three attempts at consistent profitability. They’ve got everything else figured out: risk management, position sizing, even a decent understanding of market fundamentals. But they can’t read the charts where it matters most.
That’s where candlestick patterns come in. These visual formations reveal market psychology as it’s happening, showing you exactly when control shifts between buyers and sellers. With forex processing over $7.5 trillion daily according to the BIS 2026 Triennial Survey, learning to read these signals separates traders who last from those who don’t.
Table of Contents
- What Are Candlestick Patterns and Why Do They Work?
- The Most Reliable Single-Candle Reversal Patterns
- Multi-Candle Patterns That Signal Trend Changes
- Continuation Patterns: When Trends Keep Moving
- How to Trade Candlestick Patterns in Live Markets
- Common Mistakes and How to Avoid Them
- Key Takeaways
- Commonly Asked Queries
What Are Candlestick Patterns and Why Do They Work?
Each candlestick tells a story. Not the romantic kind you’d find in trading books, but a brutal record of who won and who lost during that specific time period. The candle shows four critical prices: open, close, high, and low. When these prices form certain relationships across one or more sessions, they create patterns that have predicted market moves for centuries.
But why do these patterns work? Simple. Human psychology doesn’t change. When sellers drive a currency pair down all session only to watch buyers push it right back up to the opening price, that creates a hammer formation. More importantly, it shows that selling pressure just got absorbed at that level. That information is worth something.
The Anatomy of a Candlestick
Every candle has three components that matter:
The body sits between the open and close prices. Thick bodies show conviction; thin bodies suggest indecision. Wicks extend above and below the body, marking the session’s highest and lowest points. Long wicks often signal rejection of those price levels. Color indicates who won: green or white means buyers closed higher than the open, red or black means sellers won the session.
These elements combine to create patterns. A tiny body with massive wicks screams indecision. A huge body with stubby wicks shows one side dominated completely.
The Most Reliable Single-Candle Reversal Patterns
Single-candle patterns pack the most punch when they appear exactly where you’d expect resistance. A perfect shooting star in the middle of nowhere means nothing. The same pattern at a major resistance level can mark the top of a multi-week rally.
1. Doji: The Standoff Signal
Doji candles form when open and close prices nearly touch, creating a cross-like shape with little to no body. They represent pure indecision. Nobody won that session.
At trend extremes, doji patterns often precede reversals because they show the current trend is running out of steam. The three most powerful variations include the gravestone doji (long upper wick, bearish at tops), dragonfly doji (long lower wick, bullish at bottoms), and long-legged doji (long wicks both directions, maximum uncertainty).
But here’s what catches most traders: doji patterns need confirmation. They set up the reversal; they don’t guarantee it.
2. Hammer and Hanging Man
These formations look identical but mean opposite things depending on location. Both feature small bodies positioned near the top of the candle with lower wicks at least twice the body’s length.
A hammer appears after downtrends and suggests bullish reversal potential. The pattern shows sellers drove prices significantly lower during the session, but buyers stepped in strong enough to push the close back near the high. That’s bullish absorption.
The hanging man has the same structure but appears after uptrends, warning of potential bearish reversal. Same shape, different context, opposite implication.
3. Shooting Star and Inverted Hammer
Shooting stars flip the hammer pattern upside down. Small body near the bottom, long upper wick. When this appears after an uptrend, it suggests buyers pushed higher but couldn’t hold those gains. Sellers rejected the higher prices.
Inverted hammers look like shooting stars but appear at the bottom of downtrends. Despite the bearish appearance, they often precede bullish reversals because the long upper wick shows buyers testing higher ground.
Multi-Candle Patterns That Signal Trend Changes
Single-candle patterns offer quick signals, but multi-candle formations provide better confirmation of trend changes. These patterns develop over several sessions and carry more statistical weight because they show sustained shifts in market sentiment rather than single-session events.
1. Engulfing Patterns
Bullish engulfing occurs when a large green candle completely swallows the previous red candle’s body. This shows buyers didn’t just overcome sellers; they dominated so completely that they erased the previous session’s losses and pushed significantly higher. Bearish engulfing works in reverse.
Trading Central’s 2025 pattern analysis shows engulfing patterns achieve roughly 65% reliability when they form at established support or resistance levels in major currency pairs. That’s solid, not perfect.
2. Morning Star and Evening Star
These three-candle patterns rank among forex’s most reliable reversal signals. A morning star forms at downtrend bottoms with this sequence: large bearish candle, small-bodied indecisive candle that gaps down, then large bullish candle closing well into the first candle’s body.
The pattern tells a clear story. Sellers dominated initially, then showed uncertainty, then buyers took complete control. Evening stars mirror this at trend tops.
What makes these patterns powerful is the three-session confirmation process. By the time the third candle closes, you’ve got substantial evidence of sentiment shift.
3. Three White Soldiers and Three Black Crows
Three white soldiers consists of three consecutive bullish candles, each opening within the previous candle’s body and closing at new highs. This shows sustained, methodical buying pressure without any meaningful pullbacks.
Three black crows demonstrates the opposite: three consecutive bearish sessions with each candle opening within the previous body and closing at new lows. These patterns suggest strong directional momentum that’s likely to continue.
Continuation Patterns: When Trends Keep Moving
Not every candlestick pattern signals reversal. Some formations suggest the current trend will resume after a brief consolidation or failed counter-trend attempt.
1. Rising and Falling Three Methods
The rising three methods appears during uptrends and follows this structure: long bullish candle, then three small bearish candles that remain within the first candle’s trading range, followed by a final bullish candle that closes above the initial candle’s high.
This pattern shows sellers attempted to reverse the uptrend but failed completely. The three small bearish candles represent weak selling pressure that couldn’t even break below the first bullish candle’s low. When buyers return in the fifth session, they typically resume the uptrend with renewed strength.
Falling three methods work identically during downtrends.
2. Pennant Patterns
Bullish pennants form when strong upward moves get followed by brief consolidations with decreasing volatility, then continuation higher. The consolidation period typically lasts 1-3 sessions and resembles a small flag or pennant shape.
These patterns suggest the initial move was so strong that even profit-taking couldn’t reverse it. Once the consolidation completes, the trend usually resumes with similar intensity to the original breakout.
How to Trade Candlestick Patterns in Live Markets
Reading patterns correctly is maybe half the challenge. The other half involves executing profitable trades based on those patterns. Most traders get the recognition part right but fail miserably at the execution.
1. Pattern Confirmation Requirements
Never trade isolated patterns. Wait for these confirmation signals first:
Volume spikes during pattern formation validate the significance. Next candle confirmation means the candle following your pattern should move in the expected direction. Support and resistance context matters because patterns at key levels carry much more weight than formations in open space. Multiple timeframe alignment ensures higher timeframes support your pattern’s direction.
Without these confirmations, you’re gambling on pretty shapes.
2. Entry and Exit Strategy
Your entry timing matters. Place orders after the confirmation candle closes, not when you first spot the pattern. Stop losses go beyond the pattern’s key level: below hammer lows, above shooting star highs.
Take profit targets should focus on the next significant support or resistance level rather than arbitrary pip counts. Aim for minimum 1:2 risk-reward ratios, ideally 1:3 or better when possible.
3. Position Sizing Based on Pattern Reliability
All patterns aren’t created equal. Allocate larger positions to formations at major support or resistance levels, patterns with clear volume confirmation, signals aligned with longer-term trends, and high-probability setups like morning and evening stars.
Reserve smaller position sizes for patterns in choppy sideways markets, single-candle formations without strong confirmation, and counter-trend signals opposing the daily or weekly direction.
Common Mistakes and How to Avoid Them
Pattern trading looks straightforward until you start losing money on textbook setups. Here are the mistakes that kill accounts and how to avoid them.
1. Forcing Patterns Where None Exist
The biggest trap is seeing patterns that aren’t actually there. A slightly longer wick doesn’t create a valid hammer. A minor gap doesn’t form a morning star. Stick to textbook formations only.
Your brain wants to find patterns everywhere because pattern recognition feels profitable. Fight that urge.
2. Ignoring Market Context
A perfect hammer at the bottom of a 5-minute downtrend means nothing if the daily chart shows strong bearish momentum. Always check higher timeframes before acting on lower timeframe patterns.
Context determines whether your pattern represents a genuine reversal signal or just temporary noise within a larger trend.
3. Poor Risk Management
Candlestick patterns fail roughly 35-40% of the time even under ideal conditions. Never risk more than 1-2% of your account on any single pattern trade. Use proper stop losses and don’t move them against you when trades turn sour.
The mathematics of trading demand you stay small on individual trades so you can survive the inevitable losers.
4. Overtrading Weak Setups
Quality beats quantity in pattern trading. Wait for formations at significant levels with proper confirmation rather than trading every pattern you spot.
The best pattern traders might only take 2-3 setups per week, but they choose them carefully. More trades don’t equal more profit.
| Pattern Type | Reliability | Best Timeframe | Confirmation Required |
|---|---|---|---|
| Doji | 60-65% | 4H, Daily | Volume spike |
| Engulfing | 65-70% | 1H, 4H | Next candle confirmation |
| Morning/Evening Star | 70-75% | 4H, Daily | Support/resistance level |
| Hammer/Shooting Star | 55-60% | 1H, 4H | Trend context |
| Three Methods | 60-65% | Daily | Volume decline then spike |
Key Takeaways
Candlestick patterns provide insight into market psychology that no other technical tool matches. These formations reveal the ongoing battle between buyers and sellers, giving you advance warning of potential trend changes and continuations.
- Pattern reliability increases dramatically: when they appear at established support and resistance levels rather than in open market space
- Confirmation is everything: never trade a pattern without waiting for volume, next-candle validation, or multiple timeframe alignment
- Context determines success: the same pattern can signal reversal or continuation depending on the broader trend and timeframe
- Quality over quantity: focus on textbook formations at key levels rather than forcing marginal setups
Master these core patterns first, then gradually expand your pattern vocabulary as you gain experience. The forex market will always provide new opportunities, but only if you can read the signals correctly.
Commonly Asked Queries
Q1. How reliable are candlestick patterns in forex trading?
Candlestick patterns typically show 55-75% reliability depending on the formation and market context. Patterns at major support/resistance levels with volume confirmation perform best, while isolated patterns in ranging markets show lower success rates.
Q2. Which timeframes work best for trading candlestick patterns?
The 4-hour and daily timeframes provide the most reliable candlestick signals for forex trading. These timeframes filter out market noise while still offering enough trading opportunities. 1-hour charts work for shorter-term trades but require stricter confirmation.
Q3. Can I trade candlestick patterns alone without other indicators?
While possible, combining candlestick patterns with support/resistance levels and volume analysis significantly improves success rates. Pure pattern trading works but demands excellent risk management and pattern selection discipline to remain profitable long-term.
Q4. How do I know if a candlestick pattern has failed?
A pattern fails when price moves significantly beyond the stop loss level (typically the pattern’s key high or low) or when the expected follow-through doesn’t materialize within 2-3 candles. Failed patterns often lead to strong moves in the opposite direction.