 Fund your Account
 Contact Support
 For Institutions
 Honor Elite

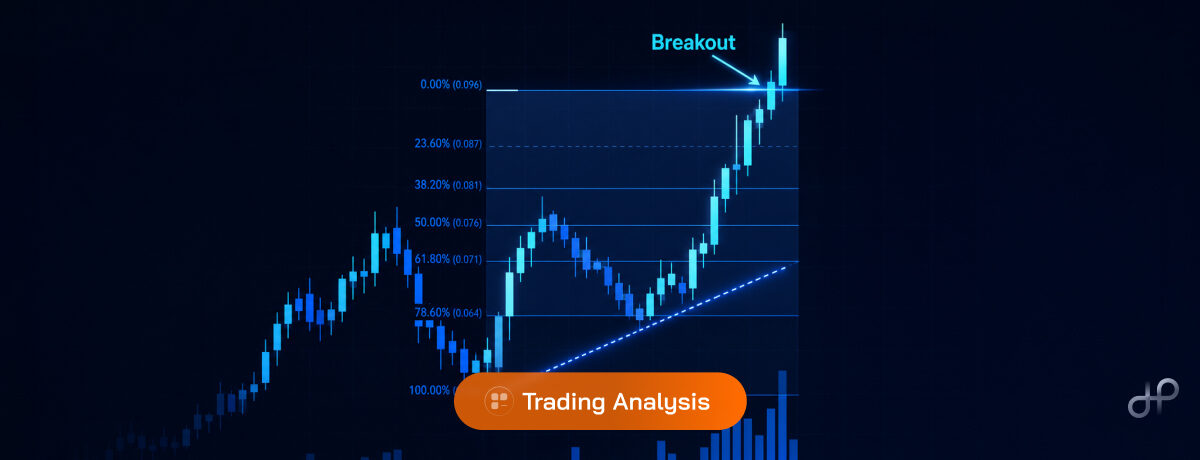
Most traders encounter the Fibonacci retracement strategy early, then spend years figuring out how to actually use it. This article breaks down the mechanics, the key price levels, and how to build entry and exit points around them. And it’s more practical than most guides you’ll find.
Table of Contents
- What Is Fibonacci Retracement?
- How the Key Levels Work
- How to Use Fibonacci Retracement for Entry Points
- How to Set Exit Points Using Fibonacci
- Fibonacci Retracement vs. Other Technical Tools
- Key Takeaways
- Conclusion
- FAQ
What Is Fibonacci Retracement?
You’ve probably seen the levels plotted on a chart before you knew what they were. Those horizontal lines sitting at 38.2%, 61.8%, 78.6% aren’t arbitrary. The Fibonacci retracement strategy pulls those ratios from the Fibonacci sequence, a number series where each value is the sum of the two before it: 0, 1, 1, 2, 3, 5, 8, 13, and so on. Divide numbers at different positions in that sequence and you consistently arrive at the same ratios. Markets, it turns out, seem to notice.
What they don’t do is predict the future. Fibonacci levels identify zones where price is statistically more likely to pause, reverse, or accelerate. That distinction matters enormously when you’re making live trading decisions.
The tool works because markets move in waves. After a strong directional move, price typically pulls back before resuming, and Fibonacci levels map where that pullback is likely to stall. Which tells you something about how seriously practitioners take it.
How the Key Levels Work?
Before you draw a single line, you need to understand what each level represents and why traders pay attention to it.
The levels divide any price move into proportional segments based on Fibonacci ratios. You anchor the tool at a swing low and drag it to a swing high (or vice versa for a downtrend), and the tool automatically plots the retracement levels between those two points. Pretty mechanical so far. The interpretation is where things get interesting.
The Core Retracement Levels
- 23.6% level: Shallow pullback, often seen in strongly trending markets where momentum is high
- 38.2% level: Moderate retracement, frequently used as a first entry zone in trending conditions
- 50% level: Not a true Fibonacci ratio, but widely watched by traders and respected as a psychological midpoint
- 61.8% level: The “golden ratio,” historically the most significant retracement zone and a common area for institutional buying or selling
- 78.6% level: Deep retracement, signals weakening trend momentum. A break below this often invalidates the original move
Key insight: The 61.8% level, derived from dividing any Fibonacci number by the one following it, appears consistently across natural phenomena and financial markets. Many professional traders treat it as the most reliable single retracement zone.
Why These Levels Hold
Part of the answer is self-fulfilling. Enough traders watch these levels that their collective behaviour around them creates the reactions you’d expect. But there’s more to it than groupthink. These zones also tend to overlap with natural market structure: areas of prior consolidation, high-volume nodes, and round-number prices cluster near Fibonacci zones with surprising regularity.
That overlap between mathematical ratio and actual market memory is what gives the tool staying power beyond the purely psychological explanation. And it’s why confluence, finding spots where multiple signals agree, matters so much when you’re building an actual trade around these levels.
How to Use Fibonacci Retracement for Entry Points
The mechanical process of drawing Fibonacci levels is straightforward. Applying them intelligently requires more discipline.
Step-by-Step: Plotting Fibonacci Levels
- Identify the most recent significant swing: Find a clear swing high and swing low on your chart. The cleaner and more defined the move, the more reliable your Fibonacci grid will be.
- Anchor the tool at the swing low for uptrends: Drag to the swing high. For downtrends, anchor at the swing high and drag to the swing low.
- Let price pull back into the grid: Don’t anticipate. Wait for the price to actually reach a level before considering a trade.
- Look for confluence: A Fibonacci level is far more useful when it aligns with a moving average, a prior support or resistance level, or a candlestick pattern>. Confluence is what separates high-probability setups from random entries.
- Set your entry trigger: Common approaches include a limit order at the Fibonacci level or a market entry on the close of a confirming candle at that zone.
The biggest mistake beginners make is treating any touch of a Fibonacci level as an automatic entry signal. It isn’t. The level tells you where to watch. Confirmation tells you when to act.
Platforms with clean charting tools and precise order execution make this process significantly easier. HonorPro, for example, provides institutional-grade charting environments designed for traders who work with layered technical setups like Fibonacci grids alongside price action signals.
How to Set Exit Points Using Fibonacci
Entry gets you into a trade. Exit determines your actual result.
Many traders spend disproportionate time on entry and treat exit as an afterthought. Not ideal. Fibonacci retracement trading gives you a structured framework for both sides of the trade, which is one reason it’s held up as a methodology across decades of changing market conditions.
1. Using Fibonacci for Stop Losses
Place your stop-loss (an order that automatically closes your trade if price moves against you by a set amount, limiting your loss) just beyond the next Fibonacci level after your entry. If you enter at 61.8%, your stop logically sits just below 78.6%. A break of 78.6% typically signals the retracement has become a full reversal, so you want to be out before that damage compounds.
2. Using Fibonacci Extensions for Profit Targets
Fibonacci extensions, levels plotted beyond the original 100% move at 127.2%, 161.8%, and 261.8%, give you objective targets for where a resumed trend could reach. The 161.8% extension is the most commonly used profit target in Fibonacci retracement trading.
A practical example: in the EUR/USD rally that developed between October 2024 and January 2025, traders who bought the 61.8% retracement of the prior leg lower and targeted the 161.8% extension of that same leg captured moves of 150 to 200 pips (the smallest standard price movement in forex, typically 0.0001 for most pairs) on multiple occasions. This is Fibonacci working as intended, not in theory.
Fibonacci Retracement vs. Other Technical Tools
No single indicator works in isolation. Understanding how Fibonacci retracement compares to other tools helps you build a more complete forex trading approach.
| Tool | Primary Use | Works Well With Fibonacci? | Key Limitation |
|---|---|---|---|
| Moving Averages | Trend direction and dynamic support | Yes, strong confluence when aligned | Lagging indicator |
| RSI | Momentum and overbought/oversold zones | Yes, RSI divergence at Fibonacci levels is powerful | Can stay overbought/oversold in trends |
| Fibonacci Retracement | Pullback entry zones and structure | N/A (the tool itself) | Requires clear swing highs/lows |
| Bollinger Bands | Volatility and range boundaries | Moderate, less precise for entries | Wide bands reduce level accuracy |
| Support/Resistance | Historical price memory | Yes, key confluence tool | Subjective placement |
RSI divergence at a Fibonacci level is worth singling out. When price reaches 61.8% but momentum is already fading on the RSI, that combination is considerably more compelling than the Fibonacci level sitting in isolation. Two signals saying the same thing, from different angles, is about as good as it gets in technical analysis.
Key Takeaways
The Fibonacci retracement strategy is one of the most durable tools in technical analysis precisely because it structures your decision-making around probable price behaviour rather than guesswork. Used properly, it gives both entry and exit logic a mathematical foundation grounded in real market structure.
- Confluence is essential: a Fibonacci level gains significance only when it aligns with other technical signals
- 61.8% golden ratio: historically the most respected retracement zone for institutional-level decisions
- Stop placement: position stops beyond the next Fibonacci level to define your risk clearly before entering
- Extensions for exits: use the 161.8% Fibonacci extension as your primary profit target on resumed trend moves
Conclusion
Fibonacci retracement is not a shortcut or a magic system. It’s a framework that brings structure to price behaviour, giving traders a repeatable way to identify where the market is likely to pause or turn. The traders who get the most from it are those who treat Fibonacci levels as decision zones rather than automatic signals. Pair them with confirmation, manage your risk at each level, and use extensions to set realistic targets. Applied consistently, this approach turns a widely known tool into a genuine edge.
Frequently Asked Questions
Q1. Does the Fibonacci retracement strategy work in all markets?
A. It works across forex, equities, commodities, and crypto, but performs best in trending markets with clean swing points. Choppy, range-bound conditions produce less reliable Fibonacci levels because the swing highs and lows are unclear and frequently overlapping.
Q2. What timeframe is best for Fibonacci retracement trading?
A. Higher timeframes (4-hour, daily, weekly) produce more reliable Fibonacci grids because swing points are cleaner and more widely respected by institutional participants. Lower timeframes can work but generate more false signals and require tighter confirmation criteria before entry.
Q3. How do I know which swing points to use?
A. Use the most recent, significant, and clearly defined swing high and low relevant to your trading timeframe. The swing should represent a meaningful directional move, not minor intraday noise. More prominent swings produce Fibonacci levels that more traders will watch simultaneously.
Q4. Can Fibonacci retracement predict reversals?
A. No technical tool predicts reversals with certainty. Fibonacci levels identify zones of probable interest. A reversal at 61.8% is a possibility worth planning for, not a guaranteed outcome. Always use confirmation signals and manage risk with a defined stop-loss.