 Fund your Account
 Contact Support
 For Institutions
 Honor Elite

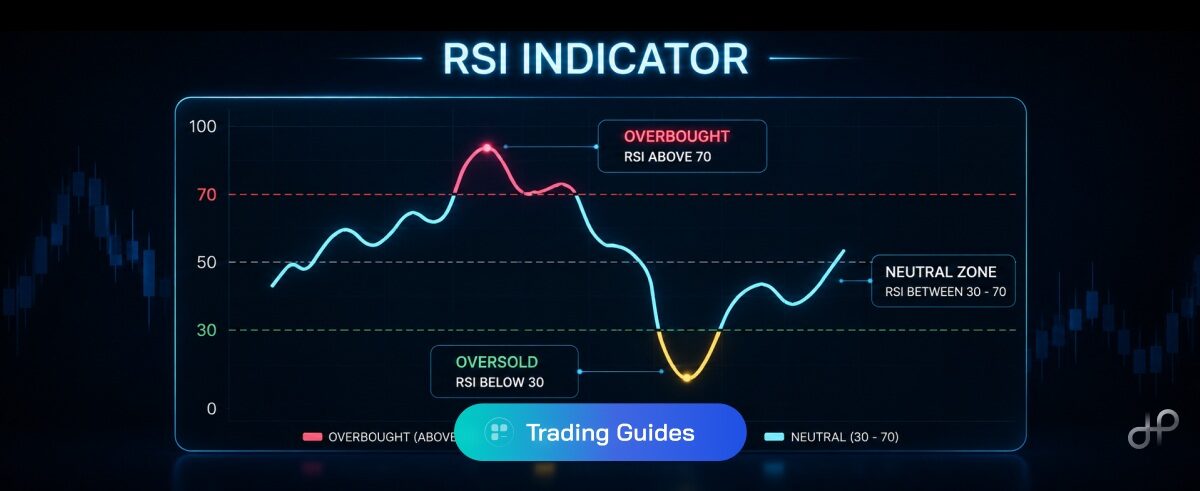
Table of Contents
- What is RSI Indicator?
- How does RSI Actually Work?
- How to Use RSI in Forex Trading
- RSI Strategies: Overbought, Oversold, and Divergence
- RSI vs. Other Momentum Indicators
- Key Takeaways
- FAQ
What is RSI Indicator?
The RSI (Relative Strength Index) indicator has been a staple of technical analysis since J. Welles Wilder introduced it in 1978, and decades later it still appears on more trading screens than almost any other momentum tool. That kind of staying power isn’t an accident. But widespread use has also produced widespread misuse, and most traders who rely on RSI are reading it wrong from day one. This article breaks down how RSI actually works, what its readings genuinely tell you, and where traders consistently go wrong applying it to forex.
If you’ve ever acted on an RSI signal only to watch price reverse immediately in the other direction, this is worth reading carefully.
How Does RSI Work and What Do the Numbers Mean?
The Core Formula
RSI compares the average size of up-moves to down-moves over a set number of periods, typically 14 candles. The result lands on a scale of 0 to 100. You don’t need to calculate this manually since every charting platform generates it automatically, but understanding the underlying logic matters more than most traders realize.
Here’s the process in simple steps:
- Calculate average gains: Sum all positive price changes over the last 14 periods, then divide by 14.
- Calculate average losses: Sum all negative price changes over the same window, divide by 14.
- Compute the ratio: Divide average gain by average loss to get Relative Strength (RS).
- Apply the RSI formula: RSI = 100 minus (100 divided by (1 plus RS)).
Think of it this way: if a currency pair closes higher 12 out of 14 days, RSI will read high, reflecting dominant buying pressure across that window. Not complicated. But what you do with that number is where things get messier.
What the Numbers Mean
- RSI above 70: Conventionally signals an overbought market, where price has risen sharply and a pullback may follow.
- RSI below 30: Conventionally signals an oversold market, where price has fallen hard and a bounce may follow.
- RSI near 50: Reflects a neutral or transitioning market, neither strongly bullish nor bearish.
Key tip: RSI above 70 does not mean “sell immediately.” In a strong trend, RSI can stay above 70 for extended periods. Use it as context, not a command.
How to Use RSI in Forex Trading?
Reading RSI Signals in Real Forex Market Conditions
Knowing how to use RSI (Relative Strength Index) in forex trading requires more than watching for 70 and 30 crossings. Those levels are starting points, not signals on their own. Context determines whether a reading is worth acting on. A value of 72 during a quiet EUR/USD session carries very different weight than the same reading during a high-volatility, news-driven move.
For forex traders specifically, RSI tends to be most reliable on the 4-hour and daily charts. On lower timeframes like the 1-minute or 5-minute, noise distorts the signal badly, and you’ll often find yourself acting on readings that flip direction before your order even fills. Not great for confidence. Not great for your account either.
Adjusting the RSI Period Setting
The default 14-period RSI is a reasonable baseline. Shorter periods (7 to 10) make RSI more sensitive, generating more signals and, inevitably, more false ones. Longer periods (21 to 25) smooth the line and filter out noise, but can lag significantly on fast-moving pairs. Most active traders keep 14 as their default and only adjust it when a specific strategy genuinely demands it, which is less often than you’d think.
RSI Strategies: Overbought, Oversold, and Divergence
Overbought and Oversold Entries
The most straightforward RSI approach is fading extremes. When RSI drops below 30 on a pair that has been trending steadily lower, some traders wait for RSI to cross back above 30 as a potential signal to go long. The reverse applies at overbought levels near 70.
The risk: this approach breaks down badly in strong trends. Selling because RSI crosses below 70 during a sustained uptrend can mean taking repeated losses on every retest of that level. Before acting, pair the signal with a trend-direction filter, such as the 200-period moving average.
That one addition changes the signal quality considerably.
How RSI Divergence Works and When to Use It
RSI divergence is where the real analytical weight sits. Divergence occurs when price and the RSI indicator move in opposite directions, and there are two forms:
- Bullish divergence: Price makes a lower low, but RSI makes a higher low. Selling momentum is weakening even as price continues to fall.
- Bearish divergence: Price makes a higher high, but RSI makes a lower high. Buying momentum is fading at the top.
Divergence is not a precise entry trigger on its own. It signals a potential shift, not a confirmed one. Seeing divergence and immediately pulling the trigger is one of the most common mistakes traders make when applying momentum indicators without proper confluence.
Platforms built for serious traders, like HonorPro, display RSI alongside customisable overlays so you can run divergence analysis and trend filters simultaneously without switching between tools.
RSI vs. Other Momentum Indicators
RSI (Relative Strength Index) is one of several momentum tools available, and understanding where it fits relative to the alternatives helps you decide when to use it and when something else might serve your analysis better.
| Indicator | What It Measures | Best Used For | Key Limitation |
|---|---|---|---|
| RSI | Speed and size of price change | Overbought/oversold, divergence | Lags in strong trends |
| MACD | Difference between two moving averages | Trend direction and momentum shifts | Slower to signal in ranging markets |
| Stochastic | Price position within recent range | Short-term reversals | Very noisy on lower timeframes |
| CCI | Deviation from average price | Identifying cyclical turning points | Less intuitive scale (not 0 to 100) |
No single indicator wins in every condition. RSI tends to perform well in ranging or moderately trending markets. In sharply trending conditions, MACD or a moving average system often produces cleaner signals with fewer false reversals. Many experienced traders run RSI alongside one trend-confirming tool rather than in isolation, which is a pretty sensible way to approach it.
Key Takeaways
The RSI (Relative Strength Index) indicator is a practical, well-tested tool for measuring momentum in forex and CFD markets. Used with discipline and proper context, it adds meaningful structure to your analysis. Used in isolation, without trend filters or risk controls, it generates enough false signals to be genuinely dangerous.
- Momentum context: RSI above 70 or below 30 signals momentum extremes, not automatic reversal points.
- Divergence analysis: Price moving against RSI direction is often a more reliable signal than simple overbought/oversold readings.
- Timeframe matters: RSI performs most consistently on the 4-hour and daily charts for forex pairs.
- Combine indicators: Pairing RSI with a trend filter, like a 200-period moving average, reduces false entries in trending markets.
Look at how RSI behaves across different market sessions and pair it with your own risk parameters before applying it live.
FAQ
Q1. What is the best RSI setting for forex trading?
A. The default 14-period setting works well across most forex pairs and timeframes. Shorter periods increase sensitivity and signal frequency but also false signals. Longer periods smooth the line but lag. Most traders start with 14 and adjust only for specific strategies or timeframes.
Q2. Can RSI be used on any timeframe?
A. Yes, RSI works on any timeframe, but signal reliability varies. The 4-hour and daily charts generally produce more dependable readings for forex. On 1-minute or 5-minute charts, RSI fluctuates rapidly, and many signals reverse before you can act on them.
Q3. What does RSI divergence mean in simple terms?
A. Divergence means price and RSI are moving in opposite directions. If price makes a new high but RSI makes a lower high, buying momentum is weakening. It’s a warning sign, not a confirmed reversal signal. Always wait for additional price action confirmation before entering.
Q4. Is RSI enough to trade forex on its own?
A. No. RSI is a useful analytical tool, but relying on it alone generates too many false signals, especially in trending markets. Most professional traders use RSI alongside trend-direction tools, volume indicators, or support and resistance levels to improve signal quality.